Overweight and obesity – BMI statistics
.png/500px-Proportion_of_overweight_and_of_obese_women,_2019_(%).png)
Obesity in the EU: gender differences
The data in this article are from the third round of the European health interview survey (EHIS) which was conducted between 2018 and 2020 and which covered persons aged 15 and over. These data indicate that substantial differences exist in the EU concerning the proportion of adults who are overweight or obese in terms of gender and socio-economic background.
(%)
Source: Eurostat (hlth_ehis_bm1e)
(%)
Source: Eurostat (hlth_ehis_bm1e)
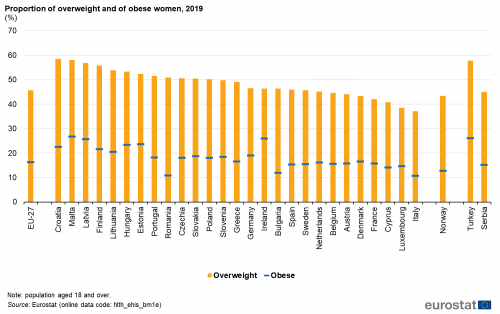
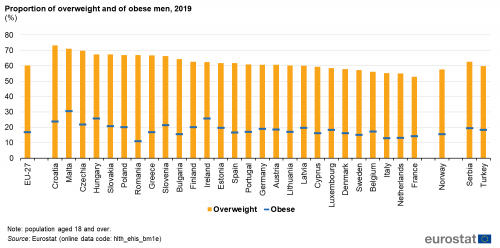
In the EU the proportion of adults (aged 18 years and over) who were considered to be overweight varied in 2019 between 37.1 % in Italy and 58.5 % in Croatia for women and between 52.9 % in France and 73.2 % in Croatia for men (see Table 1).
In 2019, the highest proportion of obese men and women was recorded in Malta.
In 2019, for the population aged 18 years and over, the lowest proportions of women considered to be obese were observed in Italy (10.7 %), Romania (10.8 %), Bulgaria (11.9 %) and Cyprus (14.1 %). On the other hand, obese men registered the lowest shares in Romania (11.1 %), Italy (12.9 %), the Netherlands (13.2 %) and France (14.3 %).
The highest proportions of women considered to be obese were recorded in Estonia (23.6 %) Latvia (25.7 %), Ireland (26.0 %) and Malta (26.7 %), while for obese men the highest shares were found in Croatia (23.7 %), Ireland (25.7 %), Hungary (25.8 %) and Malta (30.6 %) (see Figures 1 and 2).
There was no systematic difference between the sexes as regards the share of obese women and men in 2019. In 17 EU Member States for which data are available, a higher proportion of men (compared with women) were obese, with Malta (3.9 percentage points – pp), Czechia and Luxembourg (3.8 pp) presenting the highest differences. By contrast, a higher proportion of women were obese in 10 Member States with Latvia (6.1 pp), Estonia (3.9 pp) and Lithuania (3.5 pp) presenting the largest differences. In Germany, Greece and Sweden the share of obese women and men was almost the same (below 0.2 pp) (see Figures 1 and 2).
A higher proportion of men (than women) were pre-obese in each EU Member State
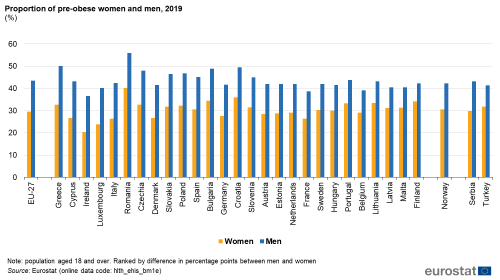
There was a much clearer picture as regards the differences between the sexes in relation to the share of the male and female populations that were considered to be pre-obese.
In 2019, across all EU Member States, the proportion of pre-obese men was consistently higher than the one for women, with differences ranging from 8.1 pp in Finland to 17.5 pp in Greece (see Figure 3).
(%)
Source: Eurostat (hlth_ehis_bm1e)
Obesity by age group
The share of the population that was overweight generally increased with age
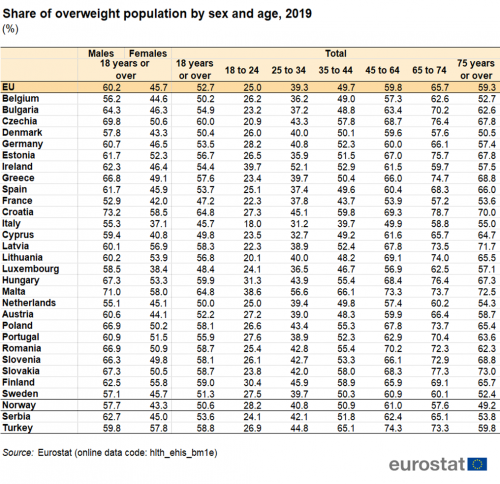
Table 1 presents the proportion of the population that was overweight in 2019, by age groups. There was a marked increase in the proportion of population that was overweight with increasing age. The age group ’18 to 24′ presented the lowest shares of overweight population (25.0 %), while the ’65 to 74’ had the highest shares (65.7 %). Exceptions to this pattern were found in Denmark, Ireland and Sweden (as well as Norway and Turkey) where the percentage of overweight was highest in the ’54 to 64’ age group.
(%)
Source: Eurostat (hlth_ehis_bm1e)
Education level and overweight
As the education level of women rose, the proportion considered as being overweight fell
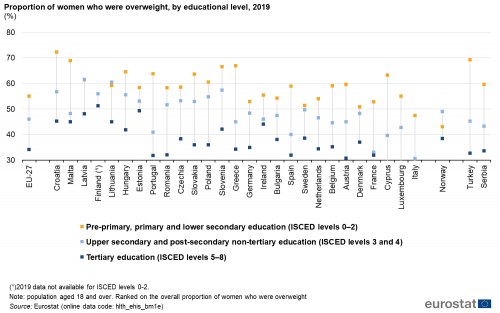
Figures 4 and 5 show the proportion of women and men who were overweight in 2019, according to their educational attainment level. The proportion of women who were overweight was lower among those with higher levels of educational attainment (see Figure 4) and this pattern held in all EU Member States. Indeed, the difference between overweight women with a tertiary education and those with no more than a lower secondary level of education was at least 32 pp in Portugal (32.0 pp), Greece (32.6 pp) and France (34.7 pp).
(%)
Source: Eurostat (hlth_ehis_bm1e)
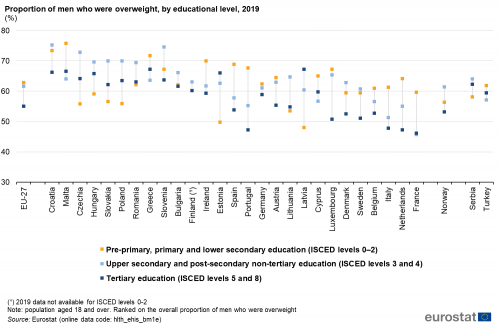
For men, there was no clear cut pattern linking educational attainment levels and being overweight (see Figure 5). The differences in the proportion of men who were overweight according to educational attainment were generally much smaller than for women. In 13 EU Member States, the highest proportion of men who were overweight was recorded among those with no more than a lower secondary level of educational attainment, while only in 2 countries – Estonia and Latvia – the highest proportion of overweight men was recorded among those with a tertiary level of education.
(%)
Source: Eurostat (hlth_ehis_bm1e)
Data sources
Health status
The European health interview survey (EHIS) is the source of information for this article. It aims to provide harmonised statistics across the EU Member States in relation to the respondents’ health status, lifestyle (health determinants) and their use of healthcare services. This source is documented in more detail in this background article which provides information on the scope of the data, its legal basis, the methodology employed, as well as related concepts and definitions.
The third wave of the EHIS was conducted in all EU Member States during 2018–2020 according to the European Commission Implementing Regulation (EU) No. 255/2018. The data presented here are the results for individual EU Member States from this third wave of the survey.
Body mass index
The body mass index (BMI) is a measure of a person’s weight relative to their height that links fairly well with body fat. The BMI is accepted as the most useful measure of obesity for adults (those aged 18 years and over) when only weight and height data are available. It is calculated as a person’s weight (in kilograms) divided by the square of his or her height (in metres).
BMI = weight (kg) / height (m²)
The following subdivision (according to the WHO) is used to classify results for the BMI:
- < 18.50: underweight;
- 18.50 – < 25.00: normal range;
- >=25.00: overweight;
- >= 30.00: obese.
The analysis of people who are overweight or obese by educational level is based upon the International standard classification of education (ISCED), 1997 version, and refers to:
- pre-primary, primary and lower secondary education (ISCED levels 0–2);
- upper secondary and post-secondary non-tertiary education (ISCED levels 3 and 4);
- tertiary education (ISCED levels 5–8).
The EHIS measures a range of indicators in relation to health determinants aside from the BMI, such as the consumption of fruit and vegetables, tobacco and alcohol, as well physical activity.
Context
According to the World Health Organisation (WHO), worldwide obesity has nearly tripled since 1975. In 2016, 39 % of adults aged 18 years and over were overweight and 13 % were obese.
Indeed, the number of overweight and obese persons has been growing in recent years and many people find it increasingly difficult to maintain a ‘normal’ weight in today’s largely obesogenic environment. This environment spans from low breastfeeding rates to difficulties in geographically or financially accessing the ingredients of a healthy diet, to a lack of cooking skills, to the abundance and marketing of energy-rich foods, to urban planning choices and lifestyle pressures that often reduce the opportunity for physical activity (both at work or for leisure). While obesity was once considered a problem only for high income countries, there has been a considerable increase in the proportion of people from low- and middle-income countries who are considered to be overweight or obese (in particular in urban areas where people are more prone to a sedentary lifestyle). The malnutrition problem has become more complex as obesity and deficiencies in micronutrients can and do go hand in hand.
Nutrition is the intake of food, considered in relation to the body’s dietary needs. Good nutrition — an adequate, well-balanced diet combined with regular physical activity — is a cornerstone for good health. Specific recommendations for a healthy diet include: eating more fruit, vegetables, nuts and grains; cutting down on salt, sugar and fats. Poor nutrition can lead to reduced immunity, increased susceptibility to disease, and impaired physical and mental development. Indeed, across the EU, six of the seven largest risk factors for premature death — blood pressure, cholesterol, weight, inadequate fruit and vegetable intake, physical inactivity, and alcohol abuse — may, at least in part, be linked to how we eat, drink and exercise.
In March 2007, the European Commission established a coherent and comprehensive Community Strategy to address the issues of overweight and obesity, by adopting the White Paper Strategy for Europe on nutrition, overweight, and obesity-related health issues (COM(2007) 279 final) focusing on action that can be taken at local, regional, national and European levels to reduce the risks associated with poor nutrition and limited physical exercise, while addressing the issue of inequalities across Member States. An Action Plan on Childhood Obesity was endorsed in 2014 by the members of the High Level Group on Nutrition and Physical Activity (with a reserve by the Netherlands). In the same year, Council Conclusions on Nutrition and Physical Activity were published.
Additional details on the latest EU initiatives on nutrition and physical activity aiming to promotion and disease prevention are available here.
link


