
Research on multi-source microstructure image recognition of foam ceramics using convolutional network combine with frequency domain

This chapter analyzes the application of the FD-Conv model in processing microstructure images of foam ceramics, focusing on its advantages in feature extraction, generalization, and prediction accuracy. Compared to other advanced deep learning models, the FD-Conv model shows higher efficiency and accuracy in both training and validation sets. It effectively leverages data diversity to enhance generalization and feature extraction when dealing with multi-source microstructure images.
Multi-source microstructure image analysis
This section demonstrates the FD-Conv model’s prediction process using multi-source microstructure images. Training begins with \(\mathrm Bi_4B_2O_9\) foam ceramics data, followed by the addition of \(\mathrm 4Bi_2O_3\) \(\cdot\) \(\mathrm xB_2O_3\) composite material data, and finally \(\mathrm BPO_4\) foam ceramics data. Model accuracy is assessed only on the training set, with results illustrated in Fig. 3. When using a single category of images, the model shows higher error: MAE for loss and accuracy are 0.8333 and 0.4444, respectively. When using images from all three categories, the model achieves the highest accuracy, with an MAE of 0.7037. Precision refers to the probability of actual positive samples among all samples predicted as positive. Recall refers to the probability of samples predicted as positive among all actual positive samples. The F1 score simultaneously considers both precision and recall, and its formula is \(\frac2F_1=\frac1Precision+\frac1Recall\). Top1_Acc indicates the accuracy of the model when the label with the highest predicted score matches the true label. Top5_Acc indicates the accuracy when the label ranked fifth in predicted scores includes the true label. MAE stands for Mean Absolute Error. Ave_loss refers to the average loss value calculated during each iteration of the training process in machine learning or deep learning. R@k is a metric used to measure the model’s ability to find relevant items among the top k retrieval results.

The addition of microscopic structure images of \(\mathrm Bi_4B_2O_9\), \(\mathrm 4Bi_2O_3\) \(\cdot\) \(\mathrm xB_2O_3\), and \(\mathrm BPO_4\). As the diversity and quantity of multi-source microscopic structure image data increase, the FD-Conv model enhances its generalization capability by learning a broader range of features and patterns, reduces overfitting, and improves recognition accuracy through more thorough training iterations.
The FD-Conv model’s ability to analyze multi-source microstructure images improves with increased data, enhancing prediction accuracy. This improvement is evident in both the \(\mathrm BPO_4\) foam ceramics data and the initial \(\mathrm Bi_4B_2O_9\) foam ceramics data after adding \(\mathrm BPO_4\) data.
Increasing recognition accuracy with more diverse training sets can be explained by:
-
(1)
Enhanced generalization: More data allows the model to learn a greater variety of features and patterns, reducing overfitting and improving generalization. With only \(\mathrm Bi_4B_2O_9\) data, the model may overfit to specific characteristics, leading to misidentification with slight variations. Adding \(\mathrm 4Bi_2O_3\) \(\cdot\) \(\mathrm xB_2O_3\) data improves feature learning and prediction accuracy, which further increases with additional \(\mathrm BPO_4\) data.
-
(2)
Shared features: Different materials may share microstructure features. A more comprehensive dataset allows the model to identify and utilize these shared features, improving predictive abilities. For instance, learning analogous features between \(\mathrm Bi_4B_2O_9\) and \(\mathrm 4Bi_2O_3\) \(\cdot\) \(\mathrm xB_2O_3\) enhances classification accuracy, which further improves with \(\mathrm BPO_4\) data.
-
(3)
More iterations: Additional data allows for more training iterations, facilitating better parameter adjustment and recognition performance. As data increases from 876 \(\mathrm Bi_4B_2O_9\) images to 1670 with \(\mathrm 4Bi_2O_3\) \(\cdot\) \(\mathrm xB_2O_3\) and 3141 with \(\mathrm BPO_4\), the model undergoes more parameter updates, gradually enhancing predictive capabilities and accuracy.
The three categories of microstructure images have varying features. \(\mathrm Bi_4B_2O_9\), \(\mathrm 4Bi_2O_3\) \(\cdot\) \(\mathrm xB_2O_3\), and \(\mathrm BPO_4\) microstructure data were captured at scales of 500, 50, and 100 micrometers, respectively.
At 500 micrometers, \(\mathrm Bi_4B_2O_9\) data shows large particle agglomeration, significant pore distribution, and large-scale surface roughness. The model learns large-scale features, but may miss subtle structural changes, reducing accuracy for smaller scales.
At 50 micrometers, finer structural textures such as smaller particles and subtle particle boundaries in \(\mathrm 4Bi_2O_3\) \(\cdot\) \(\mathrm xB_2O_3\) are observable. Introducing this data enhances the model’s ability to recognize fine features, improving overall accuracy.
At 100 micrometers, medium-scale structural features in \(\mathrm BPO_4\) data exhibit both irregular pore structures and periodic crystalline shapes. Including \(\mathrm BPO_4\) data helps the model discern features at this scale, enhancing generalization and prediction accuracy.
The combined feature information from multiple scales allows the model to better understand foam ceramics’ microstructures, enhancing generalization capabilities, reducing overfitting, and increasing classification accuracy. Cross-material learning from different scales enriches the model’s feature space, significantly reducing blind spots in structural changes.
Frequency domain block effect
This section discusses the impact of the Frequency Domain Block in the FD-Conv model on predicting foam ceramics microstructure images. Incorporating a Frequency Domain Block in the FD-Conv model offers several advantages:
-
(1)
Combination of Frequency and Time Domains: The FD-Conv model integrates time-domain convolution with frequency-domain high-pass filtering, allowing the extraction of both spatial and frequency features. This enhances the capture and understanding of complex structural features in foam ceramic microstructure images.
-
(2)
Frequency Domain Processing Capability: By employing fast Fourier transforms and high-pass filters, the Frequency Domain Block processes information effectively within the frequency domain. This is crucial for capturing high-frequency details such as small pores and cracks, which are essential for evaluating material performance.
-
(3)
Suppression of Noise and Background Interference: The frequency domain processing capabilities of FD-Conv help suppress noise and background interference through filtering operations, enhancing feature purity and improving model robustness and prediction performance.
The FD-Conv model’s ability to combine and process frequency and time domains enables accurate and comprehensive microstructure prediction and analysis. These design features improve the model’s performance on metrics such as R@1, precision, and F1 score. The Fourier transform images in Fig. 4 show original microstructure images processed through Fourier transform, semantic segmentation, and inverse color processing, facilitating the analysis of symmetry, ring structure, and frequency components. Figure 4a–h show images successfully predicted by the FD-Conv model, while Fig. 4i–j depict unsuccessfully predicted images.
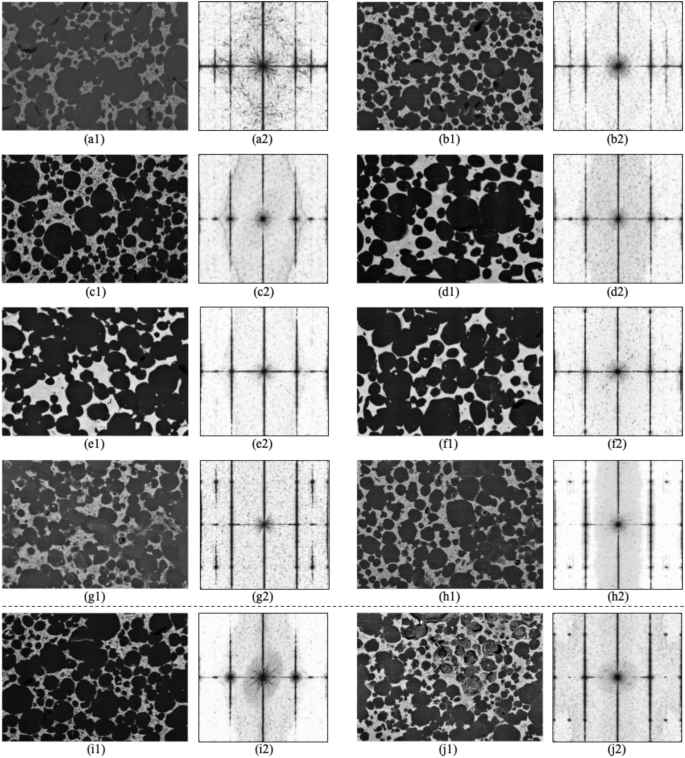
The Fourier Transform spectra shown the symmetry and ring structure characteristics of the microstructure images. Images with simpler structures have a higher prediction success rate, while those with more complex structures are more difficult to predict. This indicates that the FD-Conv model has limitations in handling more complex periodic structures and high frequency components.
The spectrograms exhibit symmetry, indicating standardized experimental operations. Figure 4a–h have simpler structures with central ring diffusion of approximately three layers, while Fig. 4i,j show more complex structures with four layers of central ring diffusion. The complexity in Fig. 4i suggests difficulties in learning average distance patterns between larger pores. No significant patterns were found in low and high-frequency components, indicating possible limitations in processing different frequency components. The brightness of images, unrelated to pore structure, is due to the shooting method.
From the prediction results, it is clear that when TA=0, the FD-Conv model struggles to accurately predict unseen \(\mathrm Mg_2B_2O_5\)+\(\mathrm MgB_4O_7\) foam ceramic microstructure images when FA=0.4. However, for other parameter changes, the model successfully makes predictions on both validation and test sets, suggesting good overall predictive capabilities with some limitations under specific parameter combinations.
Visual analysis of microstructures
The FD-Conv model employs four Blocks that enhance its interpretability through visualization analysis of foam ceramics microstructure images.
The generation of heatmaps in the convolutional layers reveals the areas of focus for the model during image recognition51. These heatmaps highlight the contribution of various regions to the model’s decision-making, effectively identifying critical areas during the learning process.
With Block depths set to [3, 3, 9, 3], Fig. 5 illustrates the heatmaps from each Block. Areas in deeper red indicate higher importance in the model’s predictions, while yellow areas receive secondary attention, and blue areas show low influence. Warm tones signify high attention zones, while cool tones indicate less relevant information.
Analysis of the heatmaps reveals that the first Block focuses on global information and low-level features. As the depth increases, the model begins to concentrate on more complex structures, such as grain shape, size, and pore distribution. The heatmap from the third Block emphasizes grains and pores, validating the model’s ability to identify these key features. If attention shifts to irrelevant areas, it suggests a need for optimization.
The most significant change occurs between the second and third Blocks, attributed to the third Block’s depth of nine layers. The heatmaps of the first, seventh, and eighth layers in this Block show substantial alterations, indicating significant feature extraction progress. The initial layers focus on fundamental features like edges and textures, while later layers recognize complex patterns such as grain arrangement and pore distribution. The heatmaps of the third Block’s 8 layers are shown in Fig. 6.
These modifications in heatmaps reflect the model’s learning progression from basic feature extraction to intricate feature recognition and integration. This systematic approach is crucial for the FD-Conv model’s understanding and analysis of complex microstructure images. Analyzing heatmaps provides insights into the learning mechanisms of the FD-Conv model, aiding in the optimization of its design and training strategies.

By observing the heatmaps of four Blocks, it can be seen that as depth increases, the model gradually shifts its attention from global information to identifying key features in the image, such as grains and pores, indicating that the model is effectively learning and focusing on areas that have a significant impact on the prediction results.

By observing the heatmaps of four Blocks, it can be seen that as depth increases, the model gradually shifts its attention from global information to identifying key features in the image, such as grains and pores, indicating that the model is effectively learning and focusing on areas that have a significant impact on the prediction results.
Comparison of different models on training and validation sets
This section compares the FD-Conv model with the latest SOTA methods, including EfficientNetV252, ViT53, MobileViT54, ConvNeXt40, and Swin Transformer55, in predicting the microstructures of foam ceramics.
The batch size for each model is set to 64, and all models are run on a 24-core AMD EPYC 7642 48-Core Processor with 80GB of RAM. After training for 200 epochs on an RTX 3090, the training and validation accuracy and loss are shown in Fig. 7. The following observations are made:
-
(1)
Feature Extraction Capability: The FD-Conv model outperforms other models on the training set, showing faster convergence and lower final loss values. This suggests that FD-Conv is particularly adept at extracting key features from foam ceramics microstructures, such as grain size, shape, and pore distribution, which are crucial for material performance evaluation.
-
(2)
Generalization Ability: Performance fluctuations on the validation set are observed across all models, likely due to the limited validation data. Although ConvNeXt performs slightly better in some instances, FD-Conv shows superior efficiency. While EfficientNetV2 and MobileViT have lower time consumption, FD-Conv achieves better overall metrics.
-
(3)
Model Complexity and Adaptivity: FD-Conv demonstrates better generalization, potentially due to a more complex network structure and training strategies. The dataset is enhanced with various operations like rotation and flipping, increasing diversity and complexity. FD-Conv’s ability to handle and recognize transformed image features contributes to its superior performance. However, this complexity also leads to higher computational costs and time consumption compared to ConvNeXt.

FD-Conv model demonstrates outstanding performance in testing with new \(\mathrm Mg_2B_2O_5\)+\(\mathrm MgB_4O_7\) foam ceramic microstructure images, achieving the highest R@1 value and F1 score among all models, indicating its efficient recognition capability and low false positive rate in predicting the microstructure of porous refractory materials.
Comparison of different models on the test set
To assess the FD-Conv model’s scalability, a new set of \(\mathrm Mg_2B_2O_5\)+\(\mathrm MgB_4O_7\) foam ceramic microstructure images is used for testing. These images are not included in the experimental data of previous section and extend beyond the original database.
The FD-Conv model’s performance in handling complex microstructure data is compared to SOTA algorithms such as RegNet30, EfficientNetV252, ViT53, MobileViT54, ConvNeXt40, and Swin Transformer55. Metrics such as prediction accuracy, recall, precision, and F1 score are used for evaluation.
Experimental results indicate the FD-Conv model’s superiority. It achieves an R@1 value of 81.8%, the highest among all models, indicating its ability to comprehensively identify the proportion of positive instances. The FD-Conv model also attains an F1 score of 78.8%, the highest among all models, reflecting its balanced precision and recall. Although its precision of 77.3% is slightly lower than ConvNeXt’s 79.5%, it still demonstrates high accuracy with fewer false positives, which are shown in Fig. 8a.

(a) FD-Conv model demonstrates outstanding performance in testing with new \(\mathrm Mg_2B_2O_5\)+\(\mathrm MgB_4O_7\) foam ceramic microstructure images, achieving the highest R@1 value and F1 score among all models, indicating its efficient recognition capability and low false positive rate in predicting the microstructure of materials. (b) The experiment by adjusting the depth of the Blocks shows that increasing the depth can improve the prediction performance and feature extraction ability of the model, but it is necessary to balance the feature extraction depth and the generalization ability of the model to avoid overfitting.
Number of different blocks
This section investigates how varying the number of Blocks in the FD-Conv model affects the prediction performance for foam ceramics microstructure images.
The original FD-Conv model uses Block depths of [3, 3, 9, 3]. To optimize performance, configurations were adjusted to [1, 1, 3, 1], [2, 2, 4, 2], and [2, 2, 8, 2]. Results for R@1, F1 score, and precision are shown in Fig. 8b.
In this section, we set the depths of the Blocks to [1, 1, 3, 1], [2, 2, 4, 2], [2, 2, 8, 2], and [3, 3, 9, 3]. The results for R@1, F1 score, and precision are illustrated in Fig. 8. The shallow structure with depths of [1, 1, 3, 1] produced R@1 at 74.2%, an F1 Score of 69.6%, and Precision at 73.1%. These results indicate that the model struggled to capture the complex features of foam ceramics. When the depths were increased to [2, 2, 4, 2], performance improved, achieving R@1 at 77.3%, an F1 Score of 73.9%, and Precision at 74.2%, but it still did not meet the demands of complex structures. Increasing the depth to [2, 2, 8, 2] enabled deeper feature extraction, resulting in R@1 rising to 81.8%, the F1 Score increasing to 76.2%, and a slight drop in Precision to 72.8%. This suggests that while the model improved its pattern recognition, it also experienced a higher rate of false positives. Finally, with depths set to [3, 3, 9, 3], R@1 remained at 81.8%, but the F1 Score rose to 78.8% and Precision increased to 77.3%. This indicates an enhanced ability of the model to identify microstructure features and suggests an optimal balance between effective feature extraction and maintaining generalizability.
Increasing the depth of the Blocks generally enhances prediction performance, particularly in F1 score and precision. However, excessive depth could lead to overfitting, demonstrating the need for a balance between feature extraction and generalization. Key advantages of the FD-Conv model include:
-
(1)
Feature Extraction Efficiency. Utilizing depth-wise separable and point-wise convolutions allows effective identification of various microstructure features at a lower computational cost.
-
(2)
Multi-Level Feature Fusion. Integration of features from different levels improves the model’s understanding of structural characteristics, enhancing accuracy.
-
(3)
DropPath Regularization. This technique prevents overfitting by randomly dropping network paths during training, improving generalization across diverse foam ceramics microstructures.
Overall, the FD-Conv model demonstrates strong feature recognition, depth of analysis, and generalization performance in predicting foam ceramics microstructures.
link


